ShopDreamUp AI ArtDreamUp
Deviation Actions


That is the histogram and the corresponding image, it is an indispensable photographic tool. First off, the camera's LCD is inaccurate and should never be trusted to judge the exposure of an image or sharpness (but that's for a different JFTP) as it is very inaccurate in colour reproduction and is not colour calibrated. Now, you're probably wondering what the heck that has to do with the histogram, well it has a lot to do with it. Most modern cameras have a histogram, on mine it was enabled be pressing the "info" button a couple times on the image review.
That presents you with something that looks like the above, it will be different for every image, but we'll use this as an example for now. I labeled the histogram with "shadow/dark", "midtones", and "highlights". The histogram tells you how many pixels are what intensity of grey, the further left, the darker the pixel, the further right, the brighter the pixel. The higher the graph goes, the more pixels are that shade of grey, so in the example image you see that there are a lot of midtones, that is denoted by how high the curve goes in the midtone section. The curve trails off before the highlights, so there are no highlights in the image at all. A keen observer might've noted that the curve is cut off on the left, that means that those pixels are pure black, or in other words you have no data there whatsoever.
That brings me to the next point, the histogram represents the latitude of the image, or how much will be shown with acceptable contrast. What that basically means is that if all of your data is to the left (ie not able to be shown on the histogram), you have a pure black image with no data whatsoever, if all of your data is to the right then you have a pure white image. How this relates to your everyday image usage and editing is; if your data is clipping (the term used for when colors are outside the latitude of the image) then you will not be able to bring it back, even if you use photoshop.
Here is an example of both of the extreme ends of the histogram with the corresponding images.
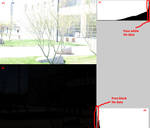
Now you see both histograms are clipping to an extreme amount, that means that neither image will be salvageable. You've probably had an extremely overexposed image or underexposed image that you thought you could bring back using photoshop or some other program, but found it wasn't possible. That was due to clipping, if you look at the histogram it will tell you whether or not the image is salvageable. One more thing that should be mentioned is that the the camera is showing you the JPEG histogram (even if you shoot RAW), with RAW you will have more data, but do not trust this enough so as you don't shoot another better exposed image.
Anyways, that's the basics of the histogram, as always if you have any questions whatsoever just leave a comment or a note and I'll get back to you on it
New Account
New Account
Yes, it is finally time to move on from this account and to a new one. If you want to continue to watch me please add ~that-fox (https://www.deviantart.com/that-fox) to your watch list. That is all.
EDIT:
Just a reminder that this account is inactive now and I am only using my new account. I will not be uploading any new art to this account. If your not watching my new account that-fox (https://www.deviantart.com/that-fox) then you're missing out on all my new pictures and my recent trip to Yosemite.
Features
:bulletblue: eARTh #3: "Beautiful Earth" Winners:
1st Place:
:winner::thumb102811920::winner:
Purity by SergioCatarino (https://www.deviantart.com/sergiocatarino)
More pieces from SergioCatarino (https://www.deviantart.com/sergiocatarino) gallery:
:thumb109238950
Throwing some thoughts out there
Stamps
:thumb101343986:
:thumb75816435:
:thumb52212910:
:thumb22074245:
:thumb70360419:
:thumb64190419:
Throwing some thoughts out there
It seems as though my summer is rather booked with college, but I want to get at least one good trip out of it. So I am looking at driving out to Yellowstone in early-mid August before the Fall semester starts up. I don't have any solid plans yet, but I thought I'd speak up about it to see if anyone is interested in going as well if it pans out. I wouldn't mind having a few people joining me for some good photography opportunities.
It'll be about a 16 hour drive for me from southern California, s
I'm alive
Stamps
:thumb101343986:
:thumb75816435:
:thumb52212910:
:thumb22074245:
:thumb70360419:
:thumb64190419:
I'm alive
Yes, surprising as it is, I am alive. Life got hectic so I was away for a good amount of time, but I'll try to get back active again now. I should be uploading a few pictures soon, so you'll have some eye candy to look at to make up for my lack of posting for a while.
And I got a new project, I'm going to be converting a Minolta Rokkor 58mm ƒ/1.2 to EOS mount soon. This will be a fun project and a very useful lens for me to have in the future, so keep your eyes pealed for some extreme depth of field in the near fu
Here's an update for you
Stamps
:thumb101343986:
:thumb75816435:
:thumb52212910:
:thumb22074245:
:thumb70360419:
:thumb64190419:
Here's an update for you
For those who were interested in my last journal I just thought that I would post an update to it. All of my old lenses were sold and have been received and enjoyed by their new owners (all the transactions went through without a hitch :)).
I've also now received all of my new lenses, which are the Canon 20-35mm ƒ/2.8L, Canon 28-70mm ƒ/2.8L, Canon 100mm ƒ/2, Canon 200mm ƒ/2.8L, and my new pride and joy the Canon 300mm ƒ/2.8L IS! I'm probably going to save up a bit more right now a
© 2008 - 2024 GKmon-DORU-fanatic
Comments10
Join the community to add your comment. Already a deviant? Log In
Thank you  (Smile)") I like your news articles! Nice that you make time for that.
I like your news articles! Nice that you make time for that.